df_aqi <- rio::import(here::here("data",
"aqidata_IPHACON2024.xlsx"))Introduction to time series analysis
Welcome to the world of Time Series Analysis and forecasting!!
1 Unveiling the Dynamics of Time: An Introduction to Time Series Data Analysis and Forecasting.
In the ever-evolving landscape of data science, understanding the intricacies of time series data has become increasingly crucial. As we embark on a journey into the realm of temporal patterns and sequential dependencies, this workshop aims to demystify the concepts and methodologies that constitute time series analysis and forecasting. Time series data, a distinctive form of information, holds the key to unraveling trends, forecasting future events, and gaining profound insights into diverse fields such as finance, economics, climate science, and beyond. So, lets dive in!!.
2 What is time series data?
Time series data is a type of data that is collected or recorded over a sequence of time intervals. Time series data is one of the most common formats of data, and it is used to describe an event or phenomena that occurs over time. Time series data has a simple requirement—its values need to be captured at equally spaced time intervals, such as seconds, minutes, hours, days, months, and so on. This important characteristic is one of the main attributes of the series and is known as the frequency of the series. We usually add the frequency along with the name of the series. In healthcare, some of the examples of time series data include:
- Daily patient records
- Hourly test results
- Monthly disease incidence rates
- Daily air quality indicators
- Weekly admissions to an emergency department
- Annual expenditures on health care
A univariate time series is a sequence of measurements of the same variable collected over time.
Think! How data collection change your analysis strategy?
How would you collect data regarding hospitalizations? Would you like to have data wherein the last hospitalization record is maintained and updated or would you like to have a single data entry point for each hospitalization?
3 Why time series analysis and forecasting?
3.1 Time series analysis.
Time series analysis is the art of extracting meaningful insights and revealing patterns from time series data using statistical and data visualization approaches. These insights and patterns can then be utilized to explore past events and forecast future values in the series. There are three different aims of Time series Analysis:-
- Descriptive analysis.
- Explanatory analysis.
- Forecasting.
3.2 Forecasting
Forecasting in healthcare is crucial for various aspects of planning, resource allocation, and managing patient care efficiently. Here are some examples where forecasting plays a vital role:
Disease Outbreaks and Epidemic Prediction: Forecasting the spread of infectious diseases, such as influenza or COVID-19, helps in preparing healthcare systems for potential surges in cases. It aids in vaccine distribution, setting up quarantine measures, and ensuring sufficient medical supplies and staff are available.
Patient Admission Rates: Hospitals and clinics use forecasting to predict patient admission rates. This helps in staffing decisions, ensuring there are enough healthcare professionals on duty to meet demand, and in planning bed occupancy rates to optimize the use of available resources.
Pharmaceutical Supply Chain: Forecasting is used to predict the demand for various medications, helping pharmacies and hospitals maintain an optimal inventory. This is crucial for managing costs, reducing waste, and ensuring that essential medicines are always in stock, especially for chronic conditions or in emergency situations.
Surgical and Procedure Needs: By predicting the demand for certain types of surgeries or medical procedures, healthcare providers can better schedule operating rooms, allocate medical staff, and ensure the necessary equipment and supplies are available, thereby improving patient care and operational efficiency.
Staffing Requirements: Forecasting helps predict staffing needs based on various factors, including seasonal trends in illnesses, epidemic outbreaks, or changing demographics. This ensures that there are enough healthcare workers, including doctors, nurses, and support staff, to provide quality care without overburdening the existing workforce.
Healthcare Policy and Infrastructure Planning: Long-term forecasts are used by policymakers to plan healthcare infrastructure, such as the construction of new hospitals or clinics, expansion of existing facilities, and investment in new technologies. These forecasts consider population growth, aging, and changes in disease prevalence.
Preventive Care Needs: By forecasting trends in various diseases or health conditions, healthcare providers can plan and implement preventive care measures more effectively. This could include vaccination campaigns, public health initiatives, or screening programs aimed at early detection of conditions like cancer, diabetes, or heart disease.
Forecasting in healthcare utilizes a variety of data sources, including historical health data, demographic trends, environmental factors, and epidemiological models. The goal is to make informed decisions that improve patient care, enhance operational efficiency, and effectively manage resources. However, it is important to understand that the predictability of an event or a quantity depends on several factors including:
- How well we understand the factors that contribute to it;
- How much data is available;
- How similar the future is to the past;
- Whether the forecasts can affect the thing we are trying to forecast.
4 Datasets used in the workshop.
4.1 Time Series Air Quality Data of Manali (2010-2023)
Regional Office Lab | City | Station Name | Sample Date | PM10 (µg/m³) | PM2.5 (µg/m³) | SO₂ (µg/m³) | NOₓ (µg/m³) | NH₃ (µg/m³) | O₃ (µg/m³) | Pb (µg/m³) | CO (mg/m³) | C₆H₆ (µg/m³) | BaP (ng/m³) | As (ng/m³) | Ni (ng/m³) | AQI | AQI Condition |
|---|---|---|---|---|---|---|---|---|---|---|---|---|---|---|---|---|---|
RO-Kullu | Manali | Manali-I | 2020-04-08 00:00:00 | 12.31 | 8.31 | 1.08 | 3.62 | 2.16 | 14 | GOOD | |||||||
RO-Kullu | Manali | Manali-I | 2021-01-13 00:00:00 | 48.86 | 2.00 | 11.24 | 3.06 | 49 | GOOD |
The dataset shared for the workshop (Table 1) is a subset of air quality data from SPCB website. The shared dataset includes data for one randomly choosen station in Manali, HP. The dataset includes data on PM 10, Pm 2.5, AQI and multiple other parameters from the meterological station.
4.2 Global Deaths from Earthquakes (1900-2023)
Year | deaths_earthquakes |
|---|---|
1,900 | 560 |
1,920 | 731,992 |
1,999 | 87,619 |
2,023 | 218,608 |
As shown in Table 2 the dataset used in the workshop is created to show global number of deaths due to earthquakes. Poverty, disease, hunger, climate change, war, existential risks, and inequality: The world faces many great and terrifying problems. It is these large problems that the work at Our World in Data focuses on. Our World in Data’s mission is to publish the “research and data to make progress against the world’s largest problems”.
df_disaster <- rio::import(here::here("data",
                       "earthquakes_IPHACON2024.xlsx"))
4.3 Monthly Road Traffic accidents in India (2014-2018)
timeline | Total Accident |
|---|---|
01/04/2014 | 39,867 |
01/08/2018 | 35,845 |
01/11/2018 | 38,417 |
01/09/2018 | 35,387 |
As shown in Table 3 the dataset used in the workshop is subset of data taken from https://data.gov.in/. It has the number of road accidents from 2014-2018 in India.
df_rta <- rio::import(here::here("data",
                       "RTA_monthly_India_IPHACON2024.csv"))
4.4 Maternal Mortality Ratio: India (2000-2020)
Year | MMR |
|---|---|
2,000 | 384 |
2,004 | 301 |
2,020 | 103 |
As shown in Table 4 the dataset used in the workshop is Maternal mortality ratio is the number of women who die from pregnancy-related causes while pregnant or within 42 days of pregnancy termination per 100,000 live births. The data are estimated with a regression model using information on the proportion of maternal deaths among non-AIDS deaths in women ages 15-49, fertility, birth attendants, and GDP measured using purchasing power parities (PPPs). The source of the dataset is WHO, UNICEF, UNFPA, World Bank Group, and UNDESA/Population Division. Trends in Maternal Mortality 2000 to 2020. Geneva, World Health Organization, 2023
df_mmr <- rio::import(here::here("data",
                       "mmr_IPHACON2024.xls"))
4.5 Campylobacter cases in Germany (2001-2011)
date | case |
|---|---|
2001-12-31 00:00:00 | 514 |
2002-01-28 00:00:00 | 815 |
2002-05-20 00:00:00 | 869 |
As shown in Table 5 the dataset used in the workshop is the counts of campylobacter cases reported in Germany between 2001 and 2011. The dataset is obtained from the surveillance package
df_campylo <- rio::import(here::here("data",
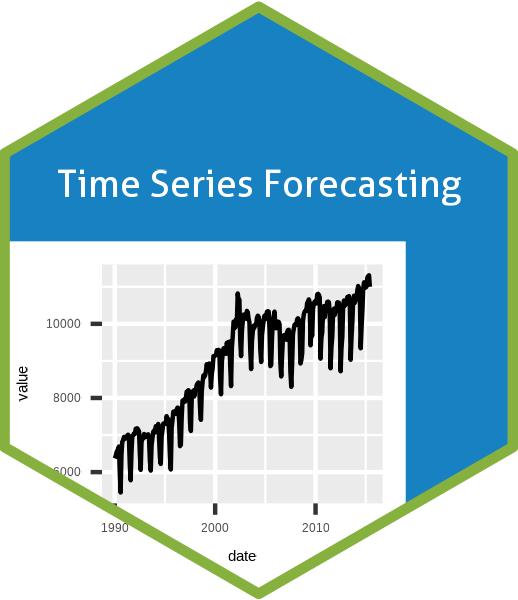
"campylobacter_IPHACON2024.xlsx"))4.6 M750 data
id | date | value |
|---|---|---|
M750 | 1990-01-01 00:00:00 | 6,370 |
M750 | 1994-02-01 00:00:00 | 7,240 |
M750 | 2006-08-01 00:00:00 | 8,580 |
M750 | 2015-06-01 00:00:00 | 11,000 |
The Table 6 represents data from the fourth M Competition. M4, started on 1 January 2018 and ended in 31 May 2018. The competition included 100,000 time series datasets. This dataset includes The 750th Monthly Time Series used in the competition.
df_750 <- rio::import(here::here("data",
                       "m750_IPHACON2024.xlsx"))
4.7 Anti-Diabetes drug sales
Month | TotalC |
|---|---|
1991 Jul | 3,526,591 |
1995 Aug | 5,855,277 |
2003 Dec | 16,503,966 |
2008 Feb | 21,654,285 |
The Table 7 represents data from the fourth M Competition. M4, started on 1 January 2018 and ended in 31 May 2018. The competition included 100,000 time series datasets. This dataset includes The 750th Monthly Time Series used in the competition.
df_diab <- PBS |>
  filter(ATC2 == "A10") |>
  select(Month, Concession, Type, Cost) |>
  summarise(TotalC = sum(Cost))
4.8 COVID-19 data
We shall be using this dataset for exercises and hence is not introduced here.